
See every rider.
Count every boarding.
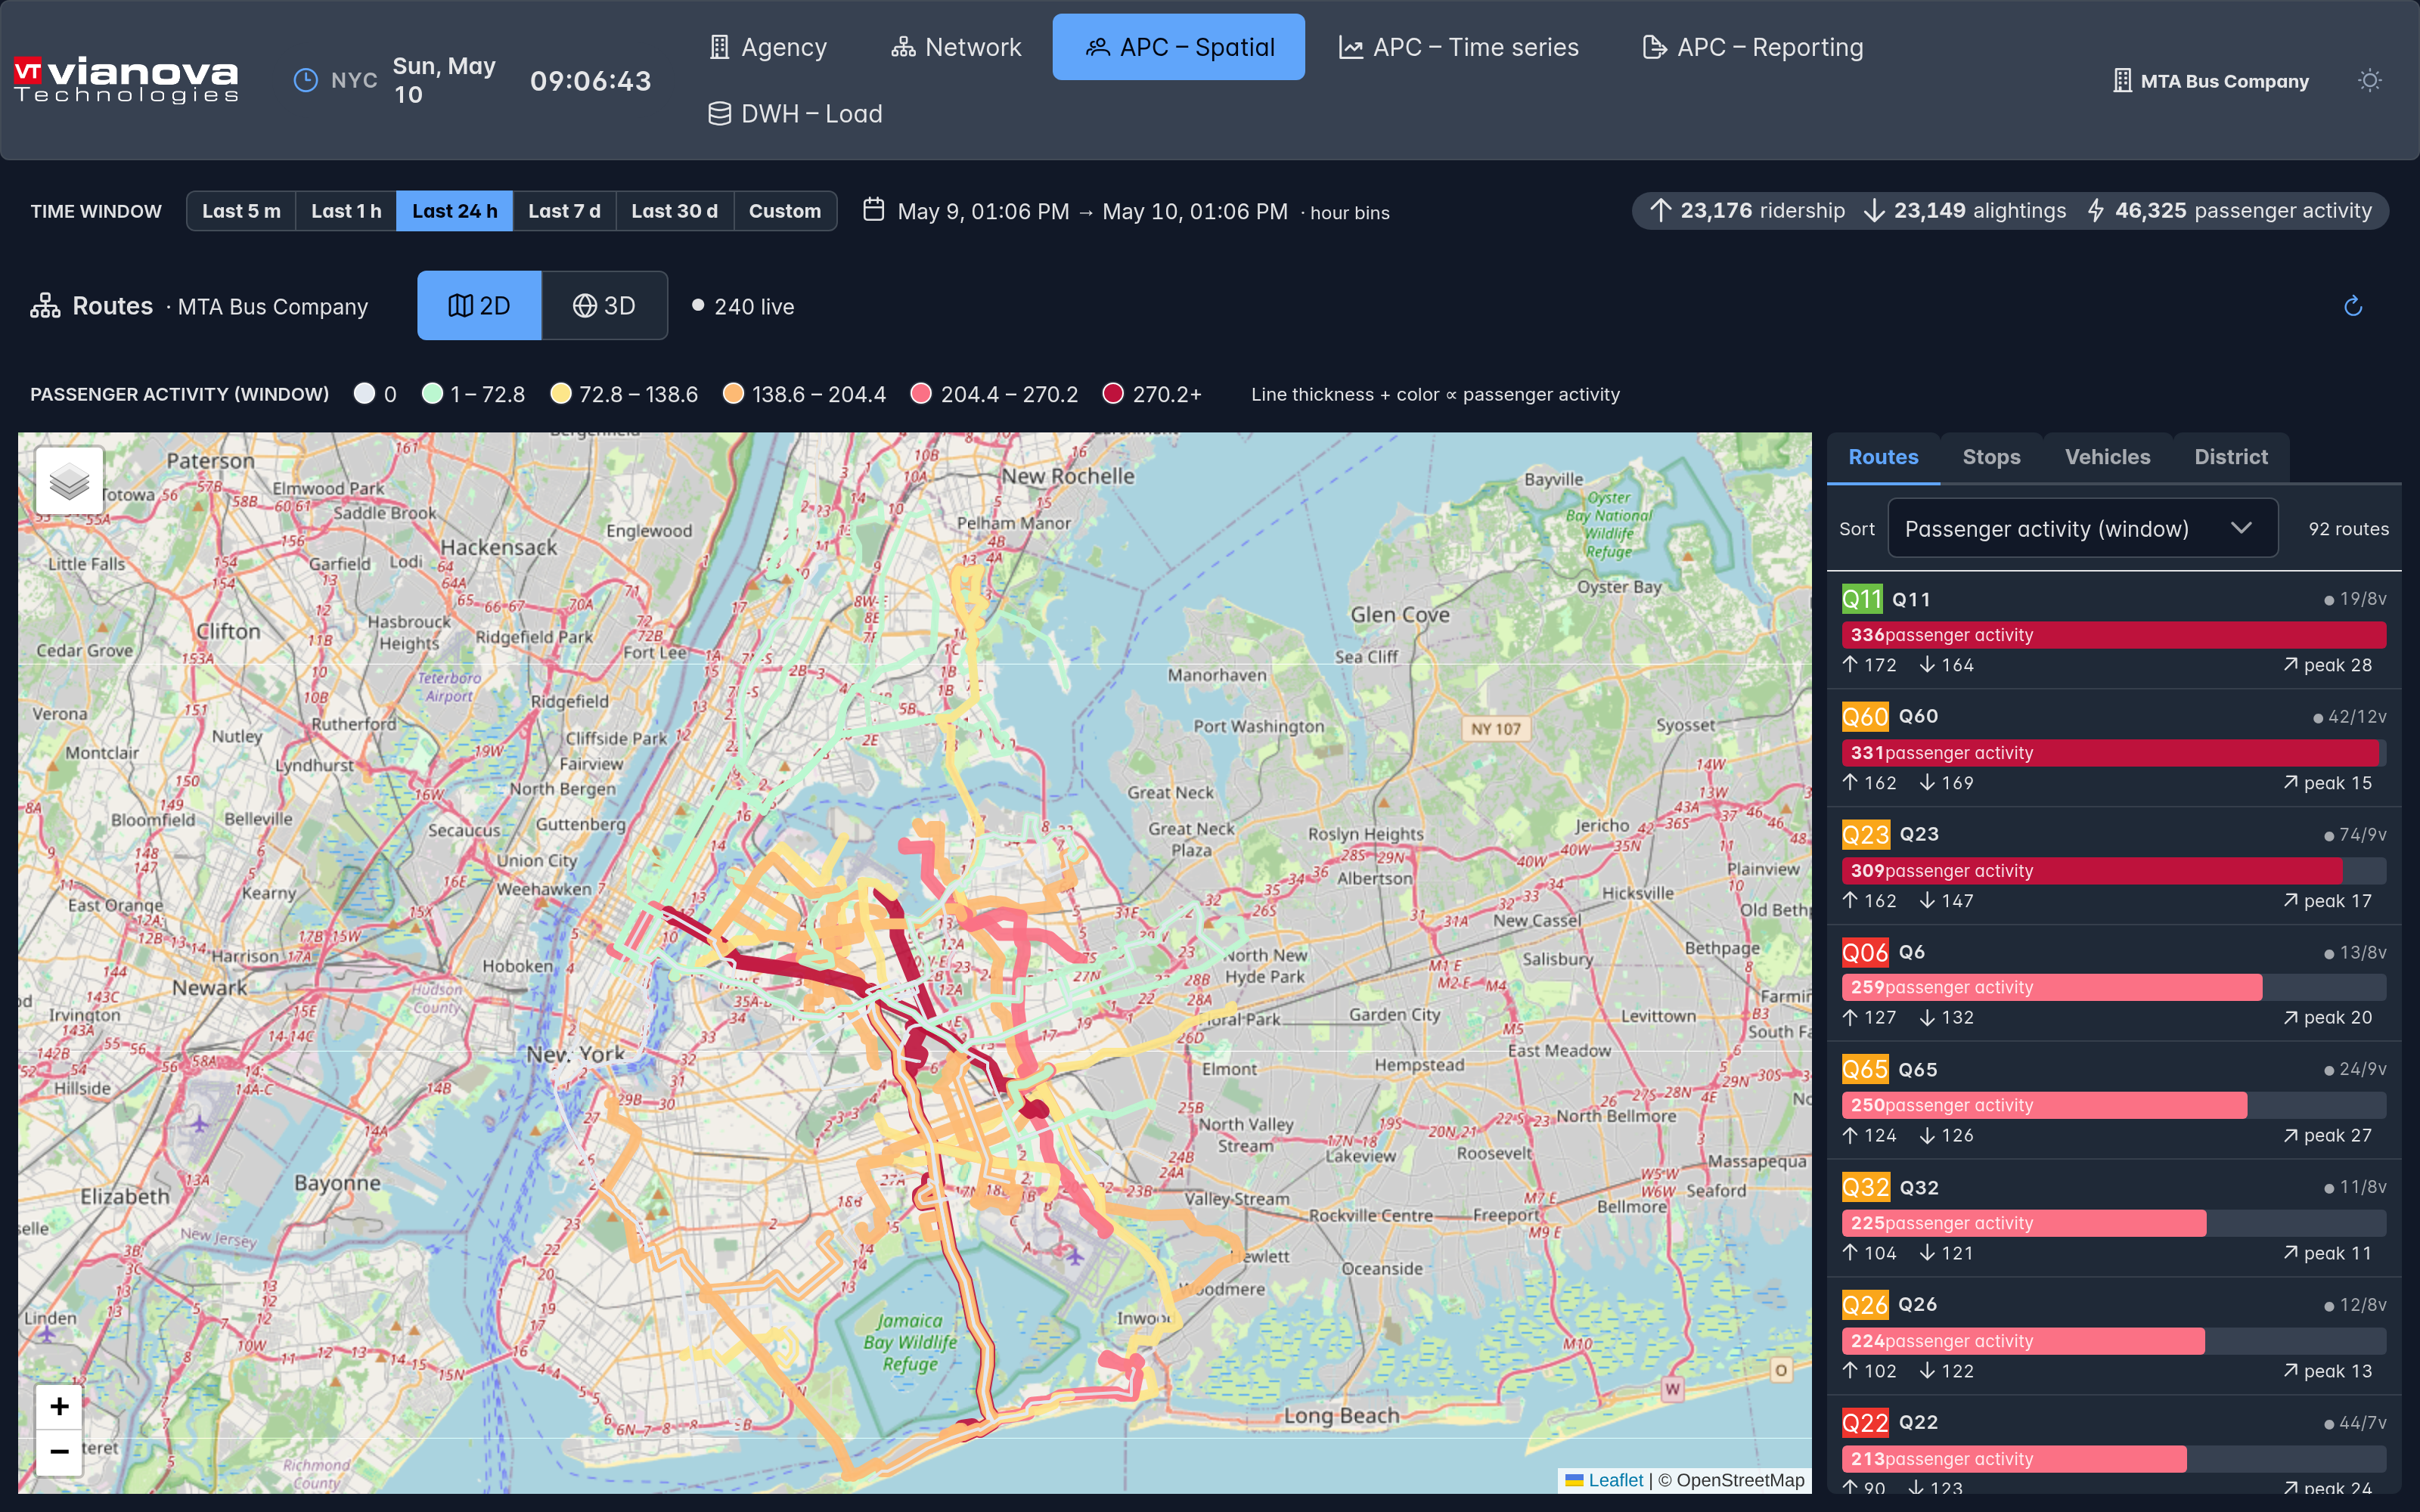
VIANOVA Platform Hub turns automatic passenger counts into decisions - accurate boardings and alightings, live occupancy, demand forecasts and audit-ready reports, all on one map.
Built for operators, authorities and mobility providers
Planning transit without real numbers
Most networks still run on estimates. Manual surveys are expensive and quickly outdated, and gaps in occupancy data turn every scheduling decision into guesswork.
Unknown demand
You can't see where riders actually board, alight or crowd - so capacity rarely matches real need.
Manual counting errors
Clipboard surveys sample a few days a year, miss peaks, and drift out of date the moment they finish.
Blind scheduling
Timetables built on assumptions leave some trips overcrowded and others running near empty.
Operational waste
Misallocated vehicles and staff drive up cost while service quality and rider trust decline.
Automatic counting, turned into insight
Onboard sensors count every boarding and alighting automatically. The Platform Hub ingests that stream in real time, matches it to routes, stops and trips, and presents it as live occupancy, trends and reports - no manual counts, no spreadsheets.
- Automatic counts - boardings and alightings captured on every trip, every day.
- Real-time occupancy - passenger load refreshed every 60 seconds across the fleet.
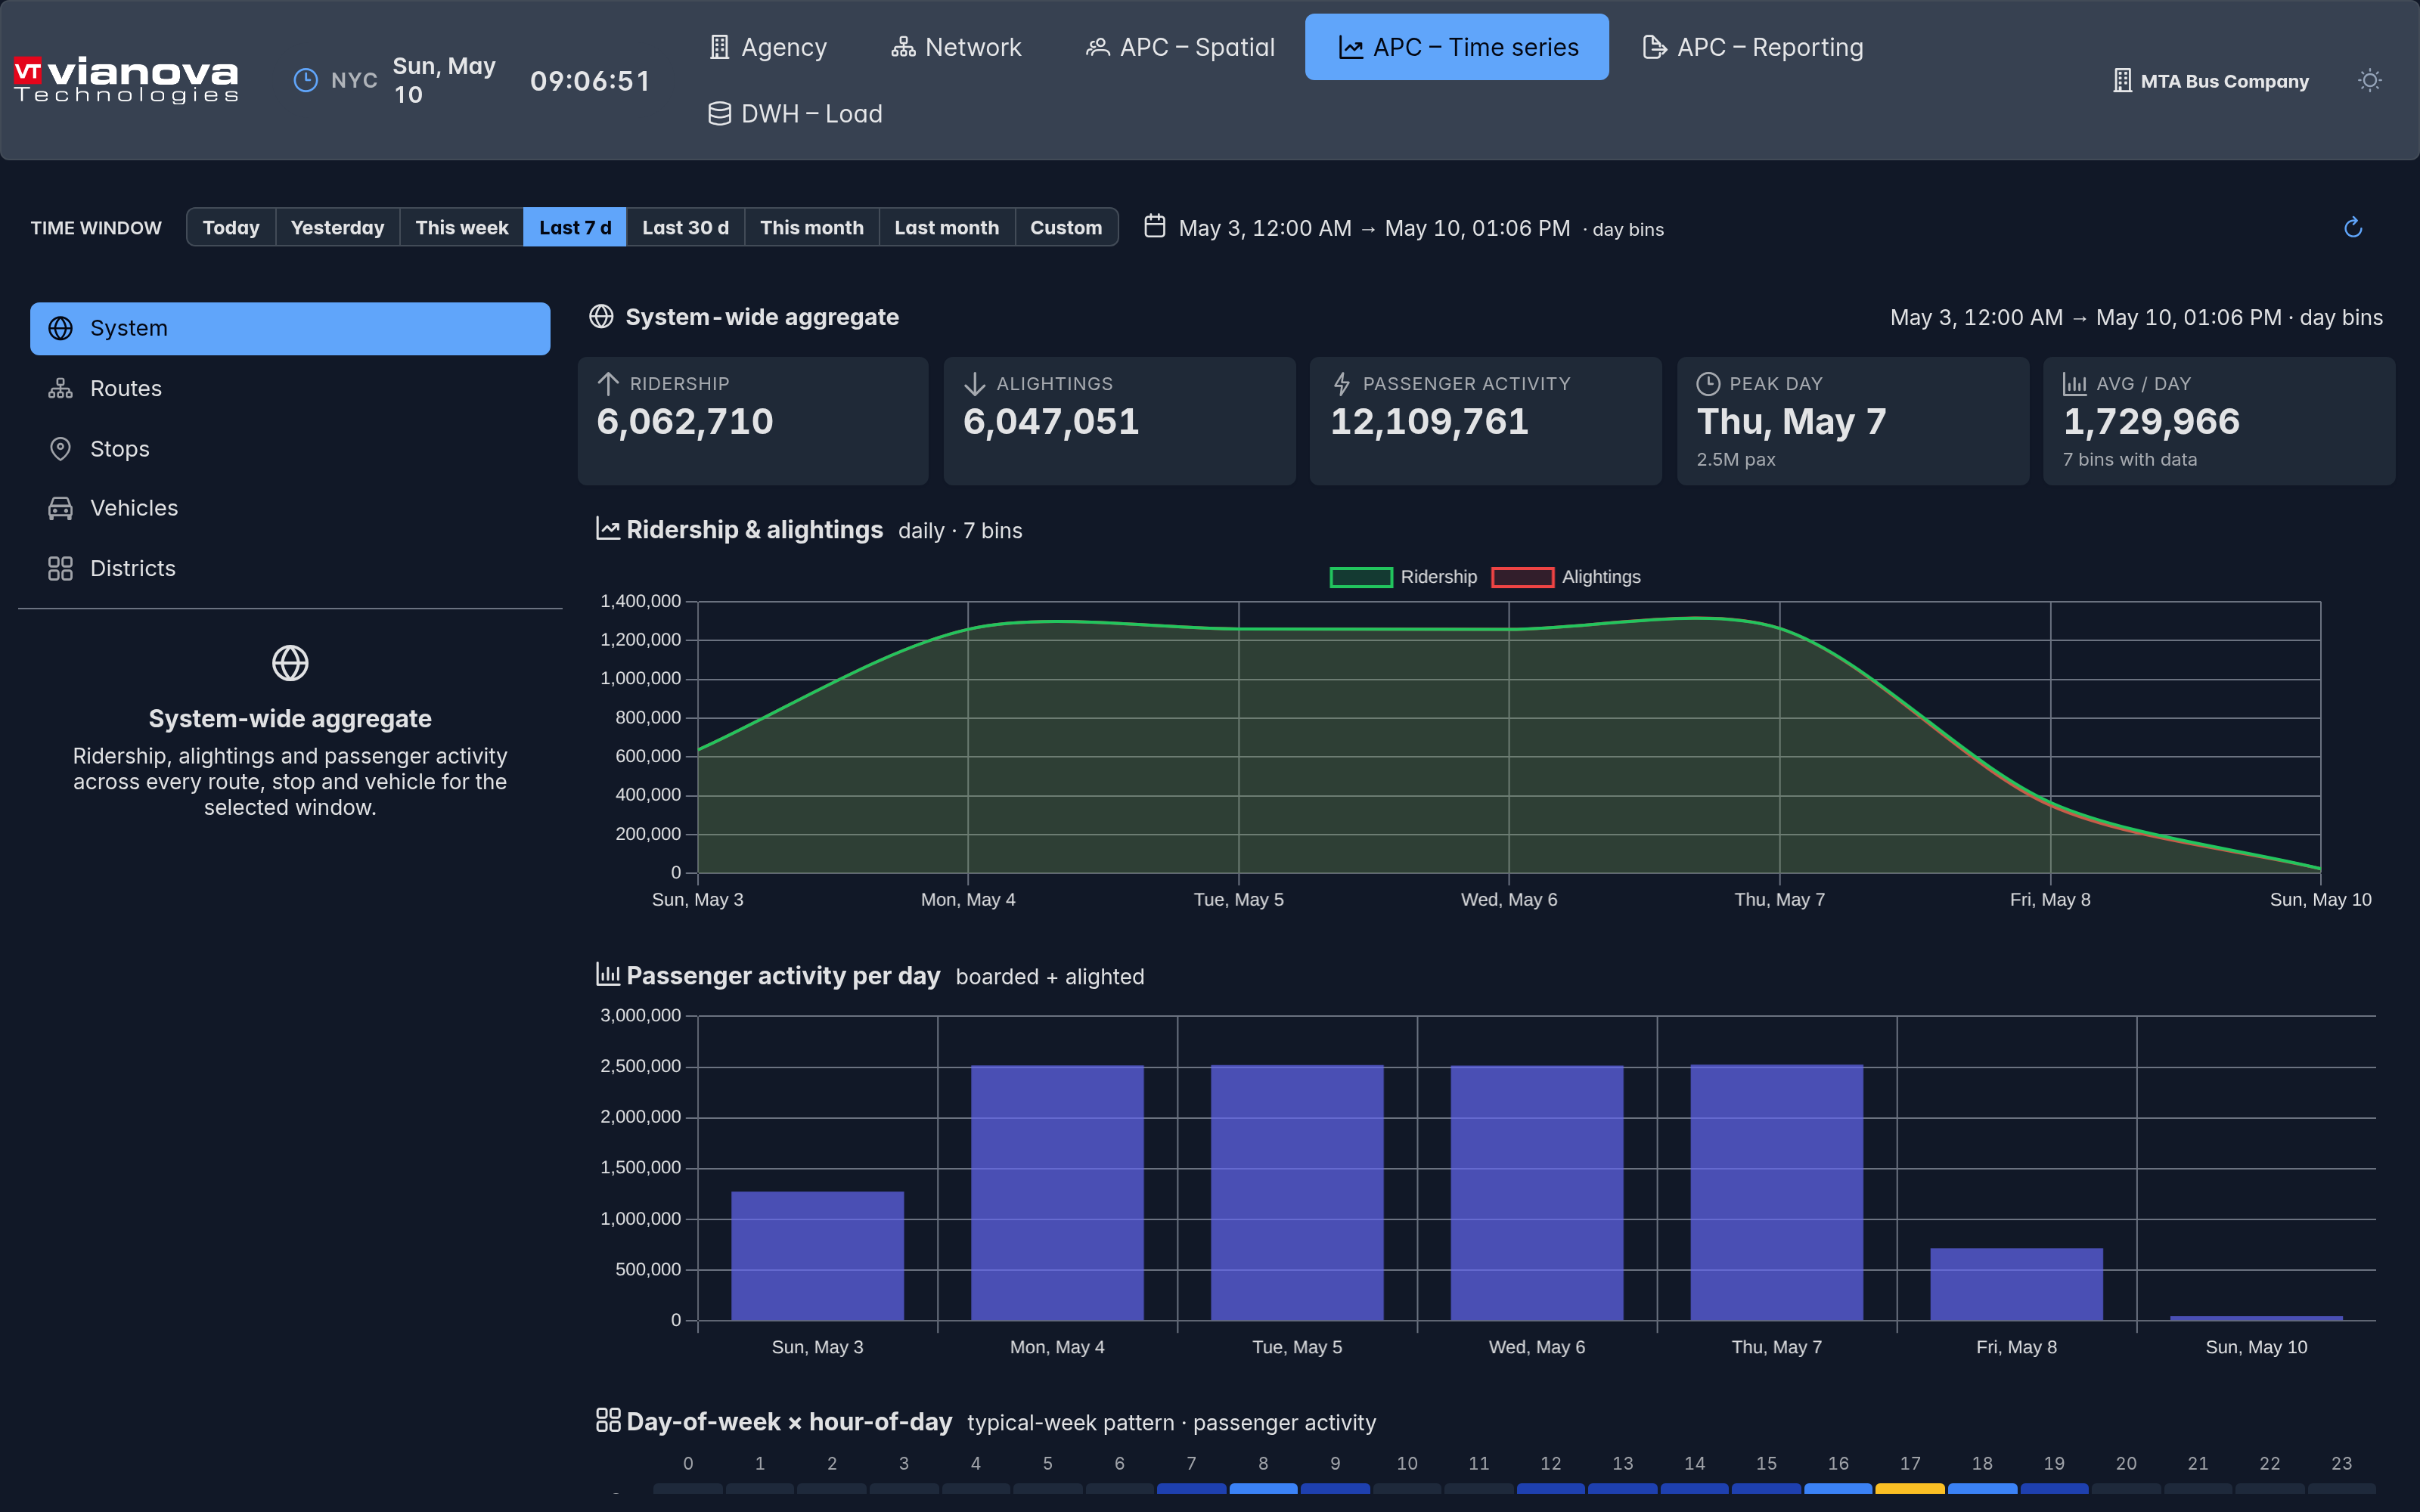
- Analytics & reporting - ridership by route, stop, hour and day, down to 10-minute bins.
- Integrates cleanly - GTFS, SIRI and VDV in; REST API and exports out.
From counts to the right service
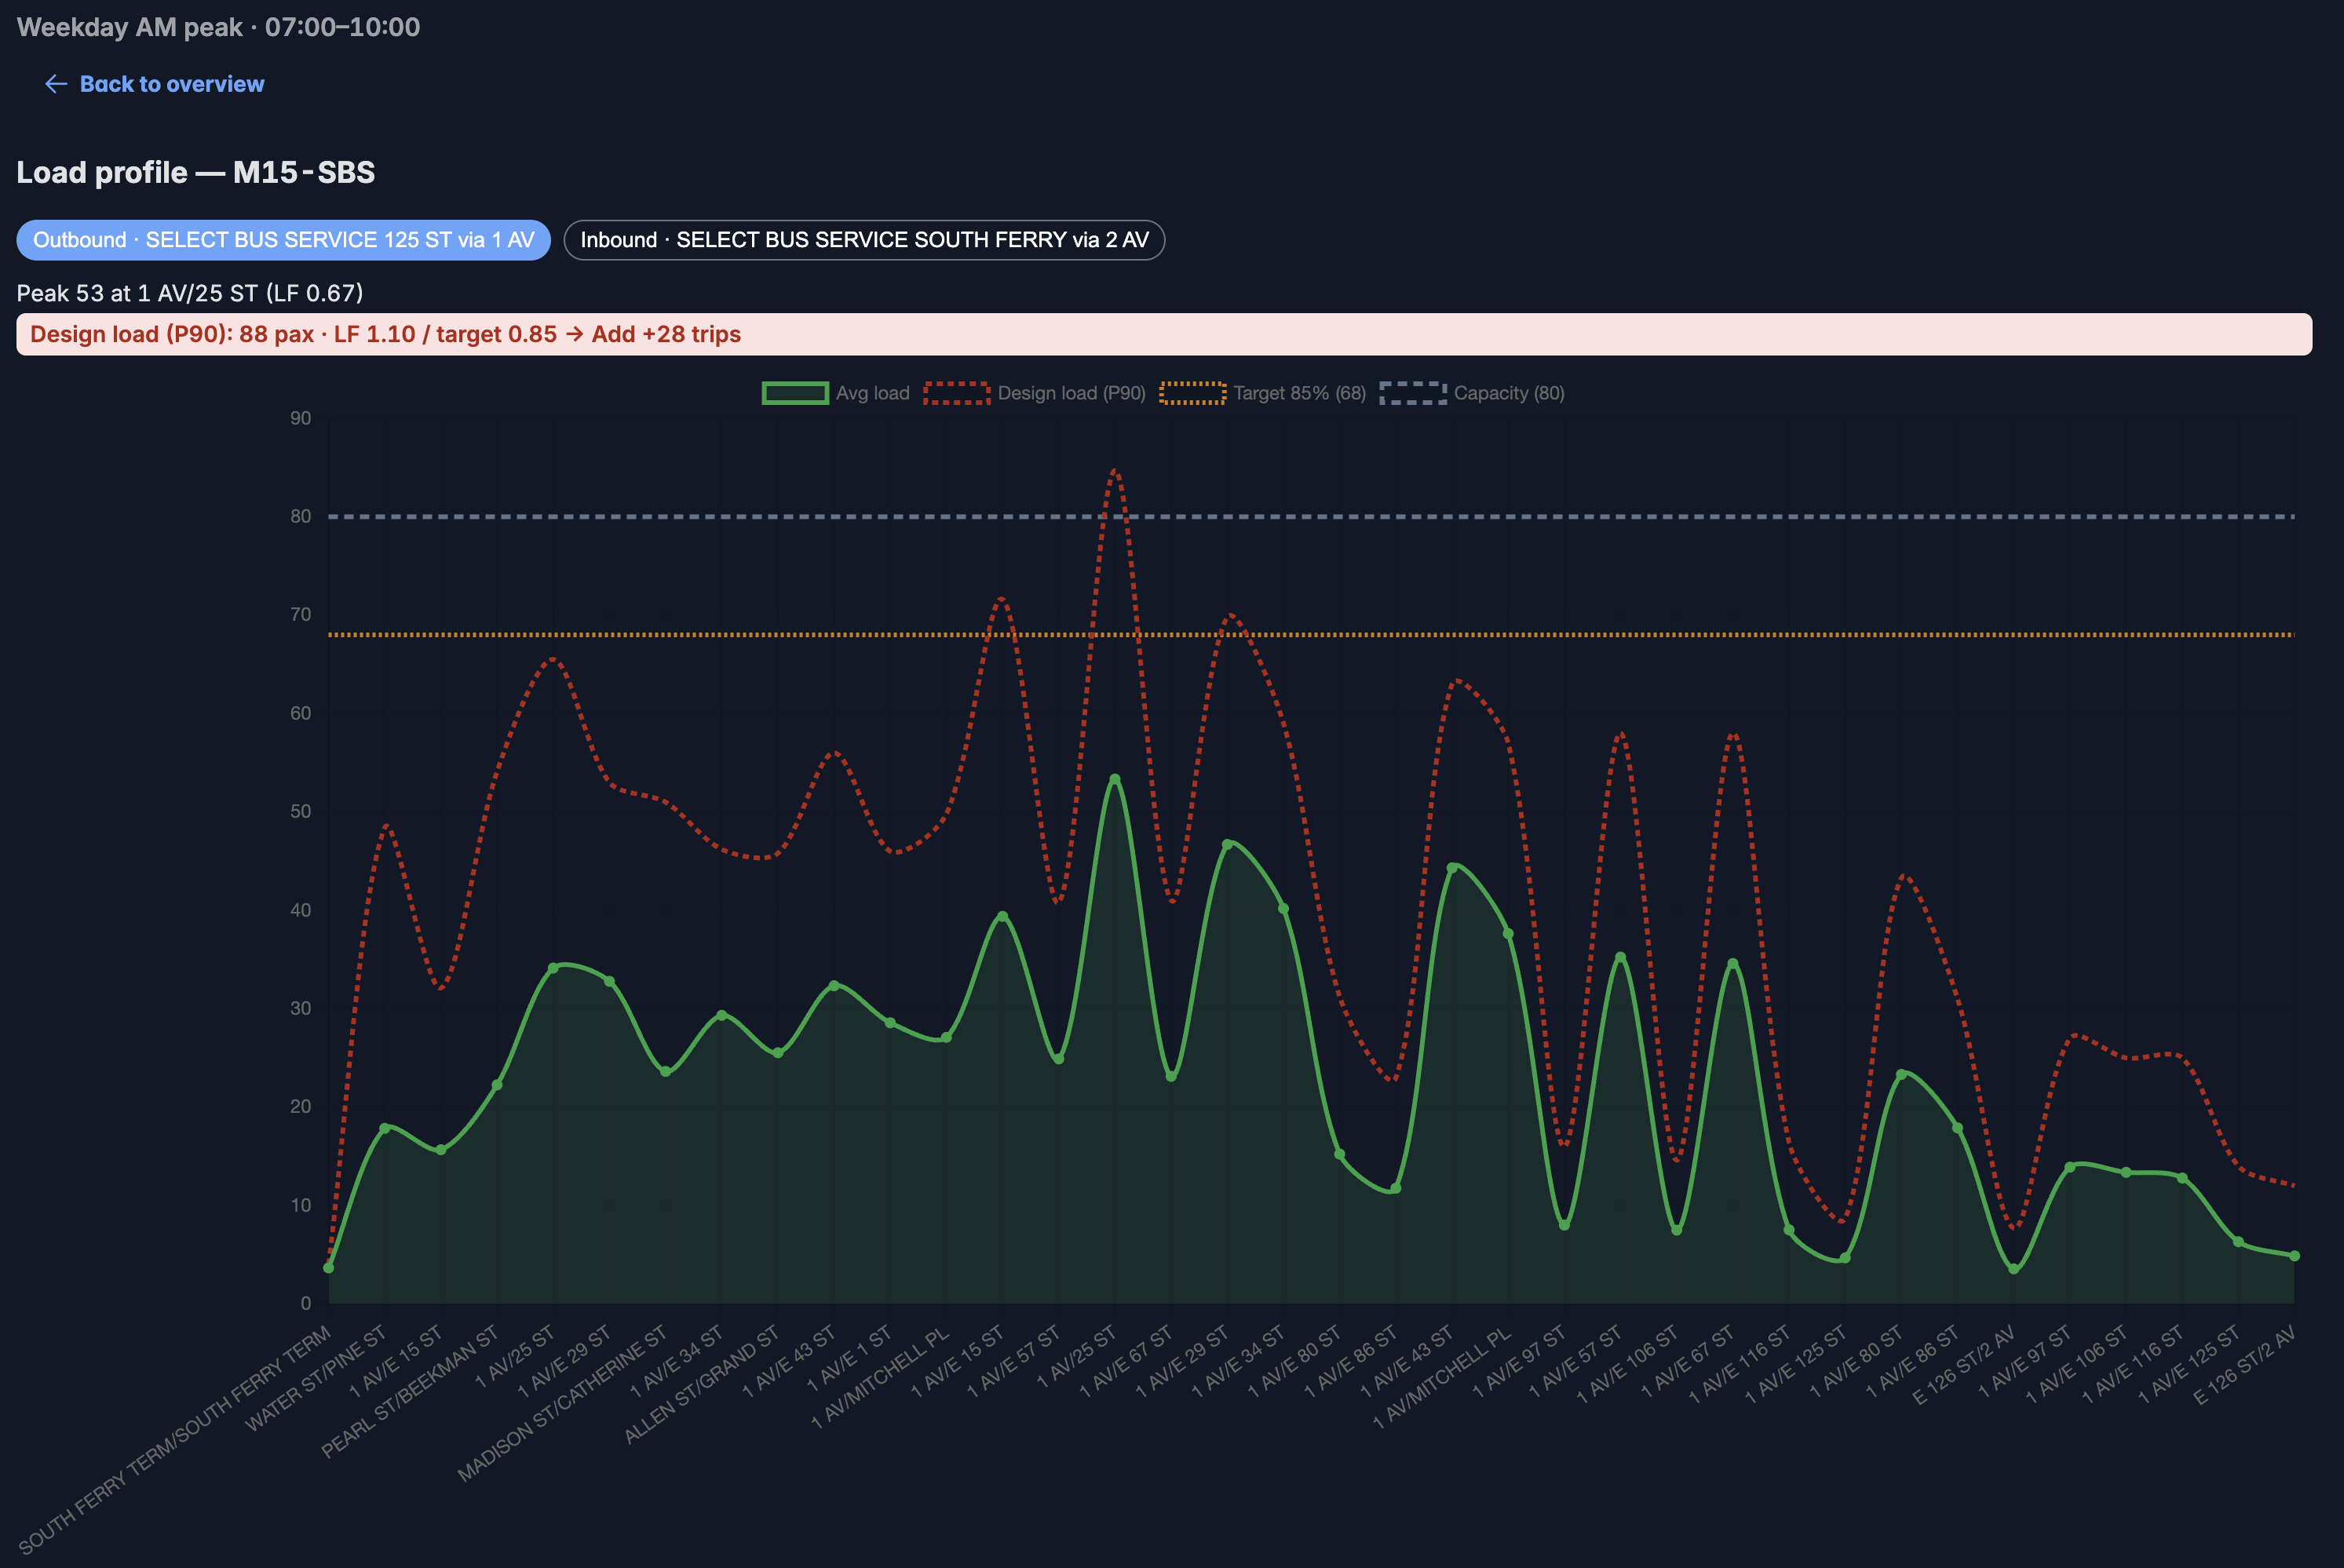
Load profiles show exactly where and when vehicles fill up, so you can right-size frequency, spot overbooked stops and plan capacity around measured demand instead of estimates.
- Load by stop & direction - see the busiest segment of every route.
- P90 design load - plan for real peaks, not just averages.
- Service recommendations - frequency changes ranked by measured overcrowding.
Everything you need to count, analyze and act
One platform for the full lifecycle - from the sensor on the vehicle to the decision in the planning office.
High accuracy
Sensor-grade boarding and alighting counts, validated against schedules and vehicle positions.
Real-time monitoring
Live occupancy and vehicle positions refreshed every 15-60 seconds on one map.
Historical analytics
Trends by route, stop, hour and day - from single trips to system-wide aggregates.
Unified dashboard
Spatial density, time series, peaks and reports in a single, consistent interface.
API integration
REST API and data exports feed your ITCS, planning tools and data warehouse.
Cloud platform
Multi-tenant, hosted and maintained - scale from one line to a national network.
Edge processing
Counting happens on the vehicle; only structured events travel to the cloud.
Demand forecasting
P10/P50/P90 ridership forecasts per route to plan capacity days ahead.
GDPR compliant
Anonymous counts by design - no personal data, privacy built in from the edge up.
Easy installation
Works with your existing sensors and feeds - no rip-and-replace required.
Fleet management
Onboard device health and firmware status alongside your passenger data.
Multi-vehicle support
Bus, tram, metro and rail - mixed fleets managed from one platform.
Measurable value, from day one
Replace assumptions with measured demand and the impact shows up across planning, operations and rider experience.
Continuous data
Every trip counted, every day - no sampling windows, no blind spots.
Network coverage
Ridership across every route, stop and vehicle instead of a survey sample.
To live occupancy
Crowding visible fleet-wide within a minute - act while it still matters.
Right-sized service
Match frequency to measured peaks - cut overcrowding and empty runs alike.
Data-driven decisions
One source of truth feeding planning, reporting and downstream systems.
Lower cost per trip
Allocate vehicles and staff where demand actually is, not where it's assumed.
The platform, in 35 seconds
A quick tour of live vehicles, passenger density, load profiles and forecasting - the counting workflow end to end.
Real screens, real data
Every image is captured from the live Platform Hub. Select any screen to enlarge.
Engineered for scale and trust
Edge-to-cloud architecture that stays accurate under load and open to the systems you already run.
Intelligent counting
Sensor fusion and validation logic keep counts accurate through crowding and door events.
Multiple sensor types
Infrared, stereo-camera and 3D sensors - vendor-agnostic ingestion.
Edge AI
Processing on the vehicle means low bandwidth and privacy by design.
Cloud synchronization
Resilient ingestion buffers offline trips and syncs the moment vehicles reconnect.
Open interfaces
GTFS, SIRI and VDV standards in; REST API and CSV/Parquet exports out.
Security & privacy
Anonymous by default, encrypted in transit, tenant-isolated access control.
One platform, every mode
From a single bus line to a multi-modal network - the same counting foundation scales with you.
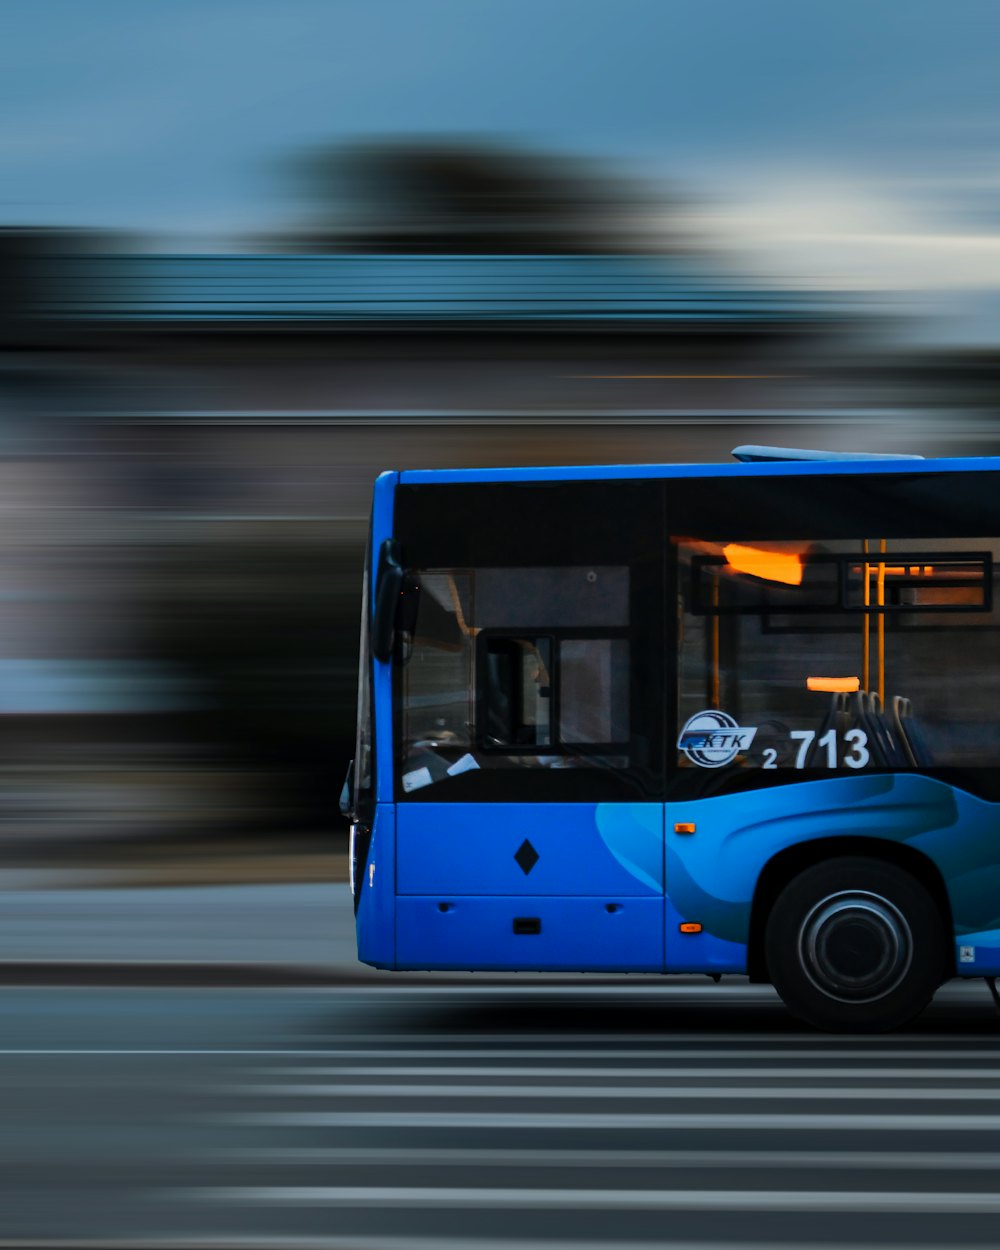
City buses
Right-size high-frequency lines and manage peak-hour crowding.

Coaches
Track occupancy and demand across regional and long-distance routes.
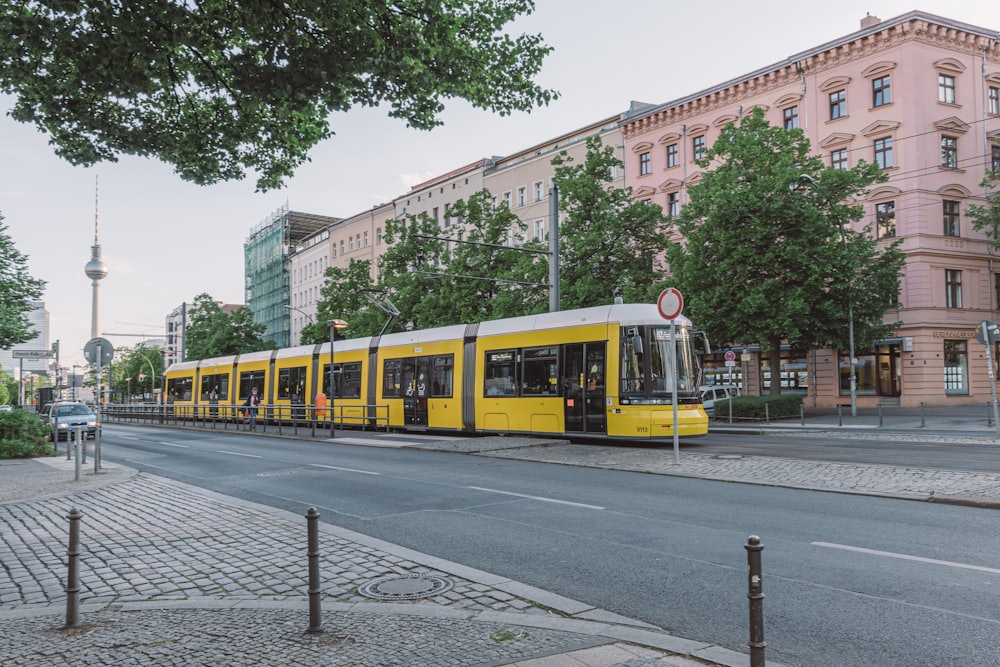
Trams
Segment-level load for dense urban light-rail corridors.

Metro
Station and car-level occupancy for high-throughput networks.

Rail
Line and service planning driven by measured ridership.

Shuttle services
Demand-responsive and on-demand fleets sized to real usage.

Smart City
Mobility data feeding city-wide planning and open-data platforms.

Authorities
Network-wide oversight and reporting across multiple operators.
A partner that knows transit
Purpose-built for public transport operations, with the reliability and support that agencies depend on.
Proven technology
Running in production on live networks, not a proof of concept.
High reliability
Resilient ingestion and buffering keep data flowing through outages.
Easy integration
Open standards and an API that fit your existing stack.
Scalable architecture
From a pilot line to national deployments on the same platform.
Expert support
A team that speaks transit - from onboarding through daily operations.
Two continents
Offices in the U.S. and Germany - experience across continents.
Ready to see your network as it really moves?
Tell us about your fleet and we'll show you the Platform Hub with a walkthrough tailored to your operation.